
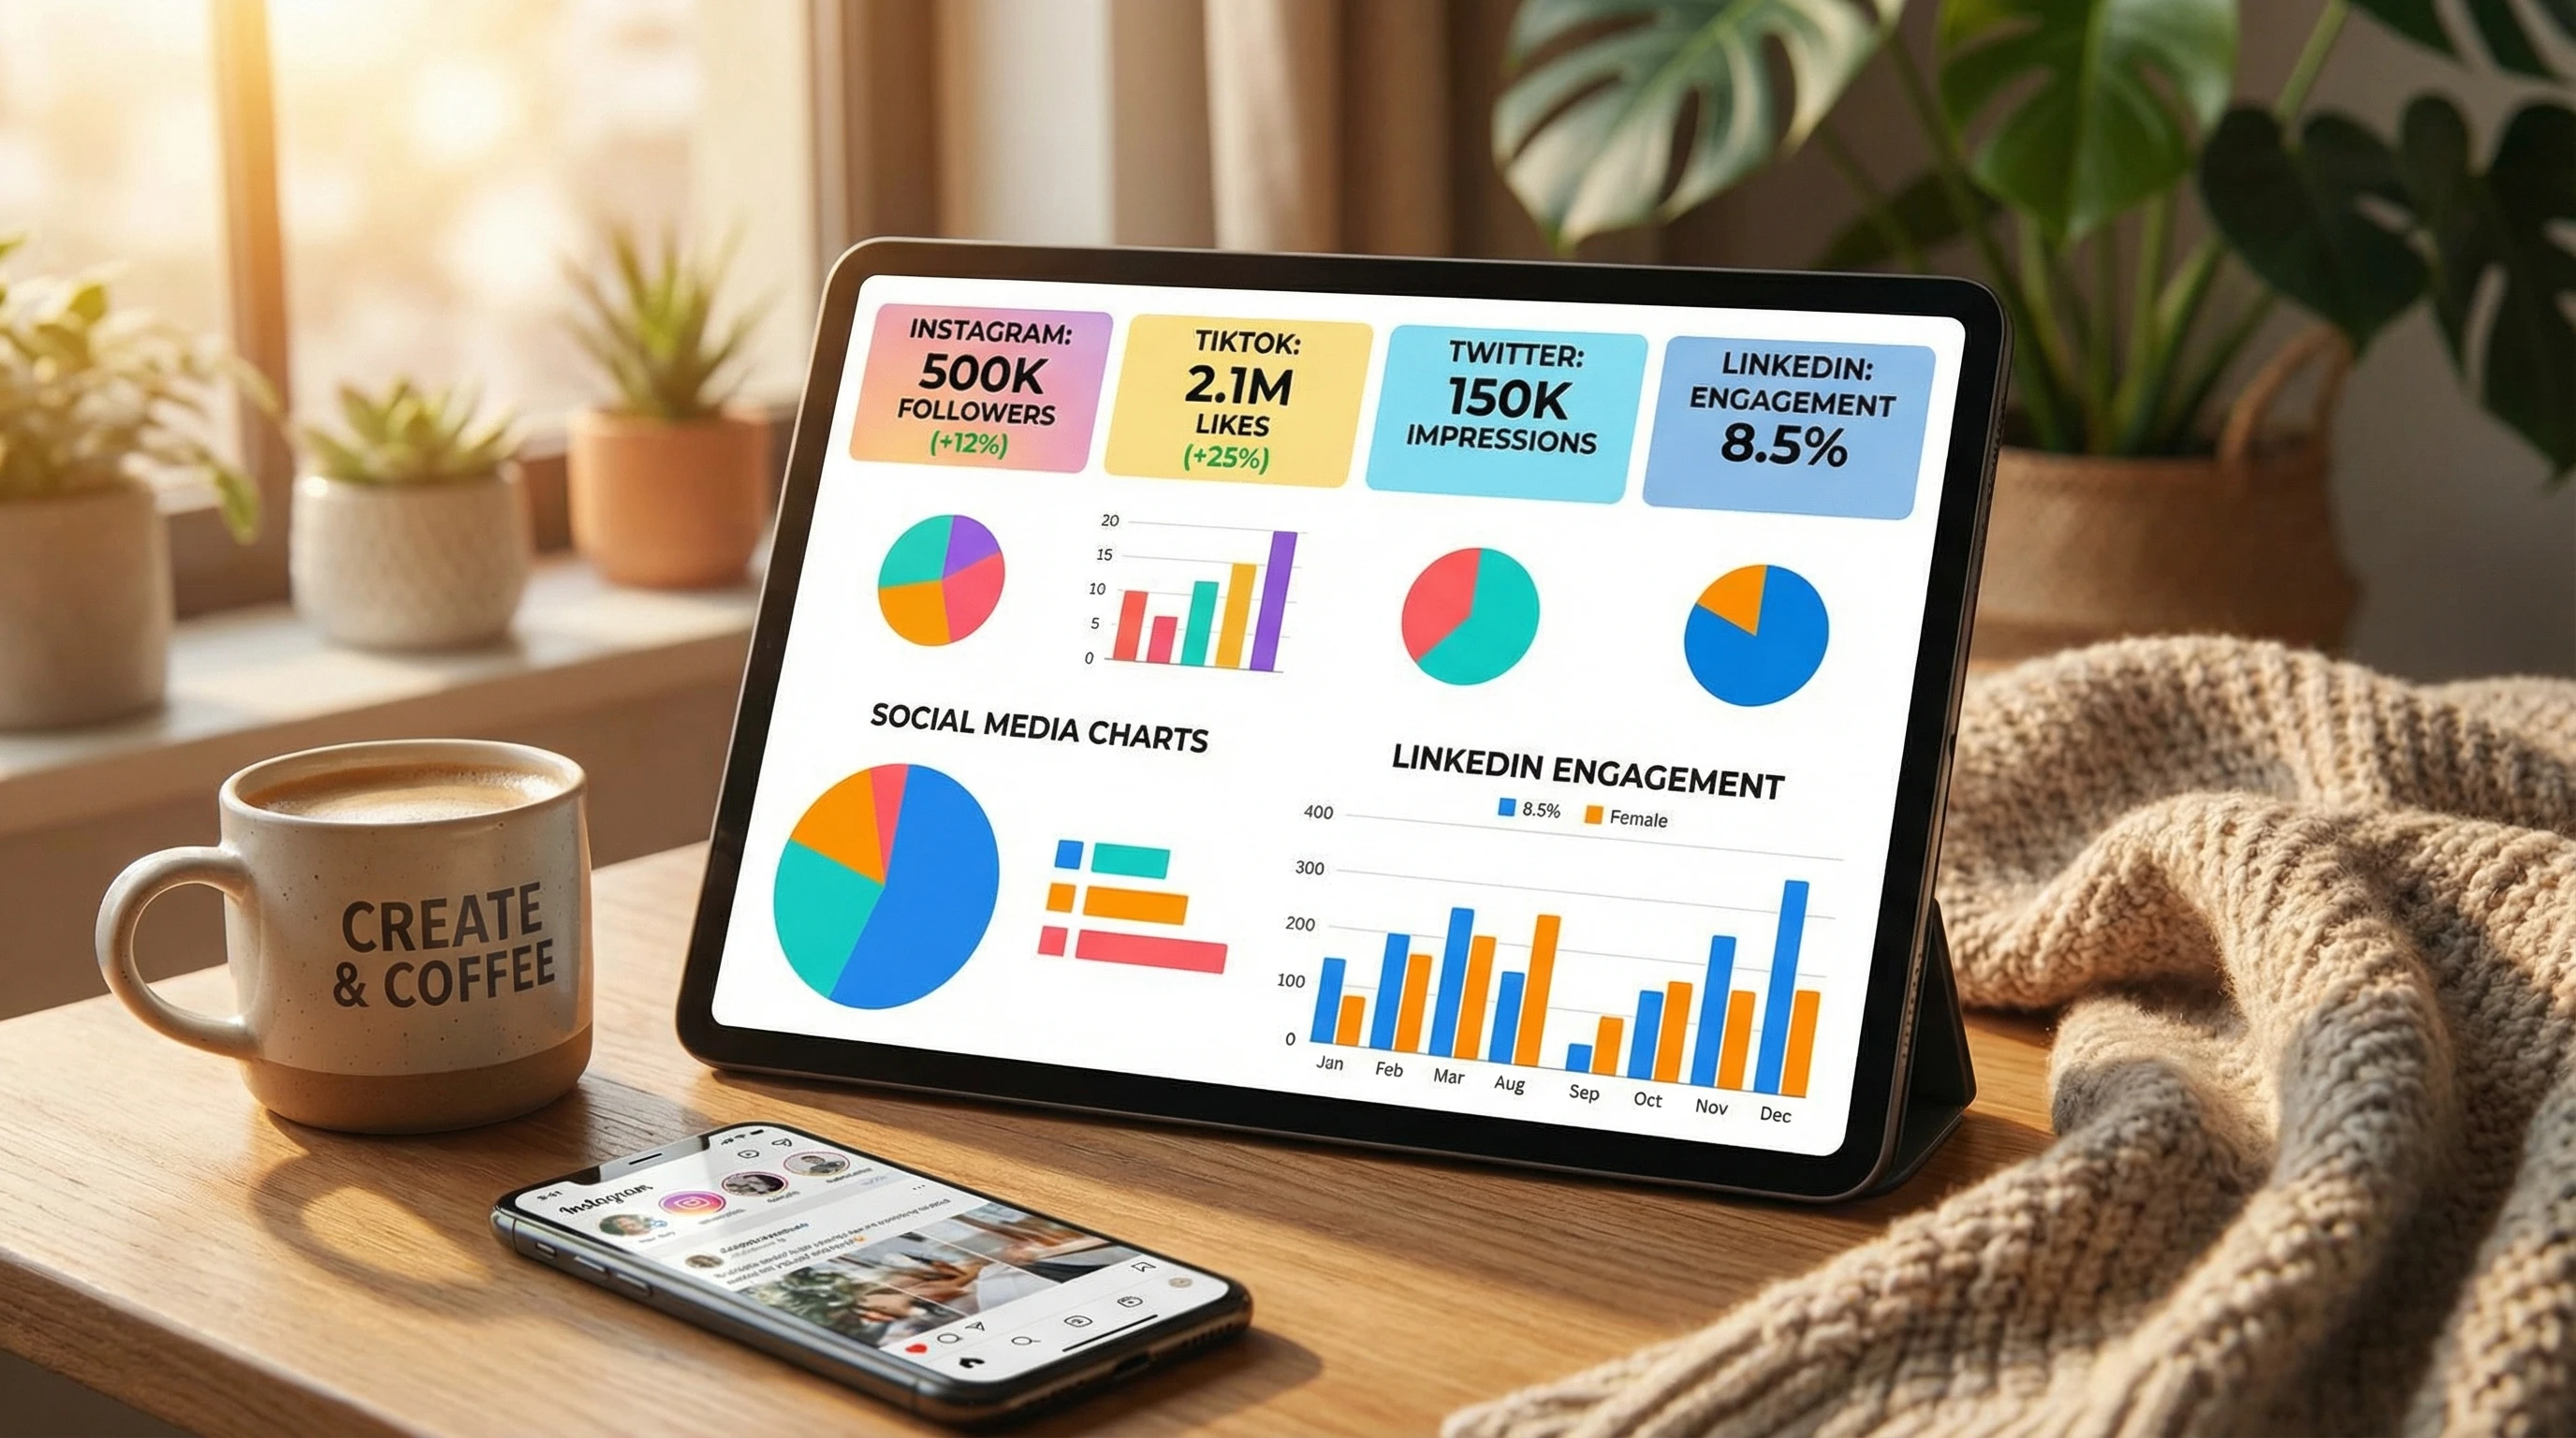
Social media metrics can tell you a lot about how your content resonates and how your accounts perform over time. If you’re running a business account or looking to grow your personal brand, staying on top of the right data is super useful for refining your strategy. With so many platforms and analytics tools out there, it’s easy to get lost in the numbers. I’m breaking down the main social media metrics you should track, and showing you how to actually use that info to get better results.
Why Social Media Metrics Matter
Checking social media metrics means you’re not guessing what’s working; you have real numbers to work with. Growth on Instagram, Facebook, X (formerly Twitter), TikTok, or LinkedIn isn’t just about posting more often. Metrics help you spot trends, identify your best performing content, and tweak your approach so your efforts actually pay off.
All the big social platforms collect tons of data, but the numbers that matter most totally depend on your goals. Maybe you want to connect with a bigger audience, get more clicks to your website, or boost engagement. Tracking the right numbers helps you figure out what’s really helping you grow versus what just looks nice at first glance.
Starting With the Basics: Core Social Media Metrics
If you’re new to tracking social stats, it helps to start with the basics. Most analytics dashboards and free tools like Meta Insights or Twitter Analytics highlight these:
- Followers or Fans: The number of people who follow your profile. This is a simple metric for tracking audience growth over time and seeing how your reach improves.
- Impressions: This shows how many times your posts appeared in feeds, whether or not people actually engaged with them.
- Reach: Unlike impressions, reach counts unique users who have seen your content, giving you a sense of how many individual people you’re actually reaching.
- Engagement: This combines likes, comments, shares, and saves. Engagement tracks how much people interact with your content, not just view it.
- Clicks: The number of times someone clicks a link or call to action in a post (for example, a website link in your Instagram bio or a swipe up on your story).
Tracking these numbers regularly shows you where you stand, and any big changes stand out pretty quickly. When your engagement rate rises while your reach holds steady, you know you’re creating stuff people genuinely care about. Consistent growth in these numbers can signal that your content is resonating, leading to more organic exposure and community building.
Taking It Up a Notch: Deeper Social Media Metrics
Once you’re comfortable with the basics, there are a few deeper stats worth checking out. These can help you fine tune your strategy even more:
- Engagement Rate: This measures the percentage of people who engaged with your content compared to those who saw it. The engagement rate can be calculated by dividing your total engagements by your total followers or reach and then multiplying by 100.
- Virality Rate: This tells you how quickly and widely your content is being shared. Divide the number of shares by your reach and multiply by 100 to get a simple percentage. If you’re getting more shares, your content could be catching on faster than you thought.
- Conversion Rate: The percentage of users who completed a desired action (like filling out a form, subscribing, or making a purchase) after clicking your post. This metric is key for social accounts that drive website traffic or sales.
- Click Through Rate (CTR): The ratio of clicks to impressions on a link or post. A high CTR usually means your call to action or headline is working well, prompting your audience to take the next step.
- Share of Voice: This one’s a bit advanced, but it helps show what portion of the online conversation around your main topics or industry is about your brand compared to competitors. Tools like Brandwatch or Hootsuite Insights track this kind of thing, making it clearer where you stand in your market.
Checking these deeper metrics can help you shape your content calendar, improve your creatives, and even plan your advertising budget more efficiently. You’ll be able to spot what’s really worth your time and effort, ensuring your strategies are always informed and goal focused.
Beginner’s Guide to Tracking Social Media Metrics
Getting into analytics is pretty easy these days since most platforms have built in dashboards. Here’s how I recommend starting:
- Pick your platforms: Decide which networks matter for your brand or business. Don’t feel pressured to be everywhere; focus on where your audience is most active.
- Check your analytics dashboard: Facebook, Instagram, X, and LinkedIn all offer free tools (think Meta Business Suite for Facebook and Instagram, Twitter Analytics for X, and LinkedIn Page Analytics). These dashboards give a quick overview and make it easy to grab your numbers.
- Record your numbers: Keep a simple spreadsheet or use tools like Buffer or Sprout Social to automate reporting. Snap a screenshot each week if you want to compare at a glance. This way, you’ll have a visual history of your performance and can see your growth over time.
- Look for patterns: Is there a day of the week where people interact more? Do certain formats (like reels, stories, or carousels) pull more engagement? Analyzing these trends can help you plan content that aligns with your audience’s preferences.
- Set goals: Decide what matters; maybe it’s ten percent more engagement this month, hitting a follower milestone, or driving more traffic to your site. Setting specific and measurable goals keeps you motivated and provides a clear direction for your efforts.
Consistent tracking makes it so much easier to see if those small tweaks in your content actually move the needle. It’s not only about having the data, but using it to adjust your activities and celebrate your wins as you notice improvements.
Common Challenges and How to Fix Them
Getting into data isn’t always straightforward. Here are some things that can throw people off, plus how I usually fix them:
- Tracking Too Many Metrics: It’s easy to get overwhelmed if you try to monitor everything. Focus on the two or three most important numbers for your current goals, and expand only when you’re comfortable.
- Comparing Different Platforms: Engagement rates, reach, and impressions mean slightly different things depending on the network. Stick to meaningful comparisons. If you’re comparing your business Instagram to your business TikTok, look at engagement rate rather than focusing solely on raw likes.
- Chasing Vanity Metrics: Numbers like follower counts or total impressions look great, but they don’t always mean you’re reaching real people or building a strong brand. Engagement and conversion focused metrics usually matter more for long term success.
- Missing Context: Drops in engagement or reach don’t always mean you’re failing. Sometimes platform algorithm changes or broader industry trends can make numbers bounce around. Checking insights over time helps you spot what’s just a seasonal dip versus something you need to address.
Making the Most of Analytics Tools
Plenty of free and low cost tools make tracking easier. I like using whatever built in analytics a platform offers, since they’re updated live and don’t need extra setup. Google Analytics is really handy for tracking how social media drives website traffic, while tools like Hootsuite, Buffer, or Sprout Social sum up your stats across platforms. The trick is picking one tool and actually using it regularly, so your numbers stay up to date and meaningful.
How Metrics Impact Content Strategy
Once you have data rolling in, it’s way easier to answer questions like “What should I post next?” or “Is this hashtag helping or just eating up space in my caption?” Here are some ways I use metrics to guide what I share:
- Topic Choices: Content that gets more shares, saves, or comments can point you toward what your audience wants more of. If behind the scenes posts always get the most likes, try making them a regular feature. Listening to your audience like this helps you keep your content fresh and relevant.
- Timing Posts: If you notice engagement peaking at certain times or days, aim to publish when your audience is most active. Adjusting your posting schedule according to the data can give your content a boost without extra effort.
- Ad Spend: Posts with strong organic reach and engagement make good candidates for boosting with paid ads—those are proven winners with your audience already. Doubling down on what works can help you get more for your advertising budget.
- Platform Focus: When one channel consistently outperforms the rest, put more energy into it. There’s no need to spread yourself thin if eighty percent of results come from one network. Focusing your efforts can help you grow faster and build a stronger community.
By continuously checking your analytics, you gain the ability to spot what topics and formats your audience loves, understand what times drive the most activity, and know where to direct your creative energies. It also allows you to see which calls to action actually convert, so you can refine your approach and maximize your results.
Real-World Examples: How Tracking Metrics Pays Off
Businesses of all sizes win when they pay attention to analytics. For instance, I’ve seen a local café spot that doubled its Instagram engagement just by tracking which stories drove the most replies. By posting more frequently with polls and question boxes, they kept customers talking and coming back. Another example is a freelance designer who switched her focus to LinkedIn after analytics showed her portfolio posts there were driving the most website clicks, even though she had a bigger following on Facebook.
- Café Example: Building community by giving stories an interactive edge with polls and direct questions increased their engagement, cultivated customer loyalty, and even led to higher foot traffic during promotions.
- Freelancer Example: Focusing effort on the channel that delivers real leads, not just likes or views, meant she could spend more time building relationships with clients who mattered most to her business. This kind of shift can really set a brand apart from competitors.
Little tweaks based on real world data make a big difference over time, whether you’re running a personal passion project or managing a brand account. Data driven decisions lead to smarter moves, more meaningful interactions, and ultimately better results for your goals.
Frequently Asked Questions
Question: How often should I check my social media metrics?
Answer: Once a week is good for most people. If you’re running campaigns or want to spot trends, daily check ins can help, but try not to stress over day to day fluctuations.
Question: What’s the most important metric for growing my audience?
Answer: Engagement rate is usually a better sign of real growth than just follower count. If your content inspires action (likes, comments, shares), you’re building stronger relationships and paving the way for ongoing growth.
Question: Can I track competitors’ social media metrics?
Answer: Some info like follower counts and public engagement is easy to see. Tools like Social Blade provide estimates for YouTube and Instagram, but deeper stats are usually private. Watch what content and formats do well for inspiration, and look for opportunities to bring your own spin to trending topics.
Final Thoughts
Paying attention to social media metrics gives you a huge advantage, no matter what platform you’re on. You get to see what really connects with people and what needs adjusting. Start simple, focus on what matters for your goals, and use that information to guide your next move. Whether you want more followers, deeper interaction, or increased conversions, the right metrics make the whole process a lot smoother and more rewarding. Keep your eyes on the data, stay curious, and have fun leveling up your social media presence!